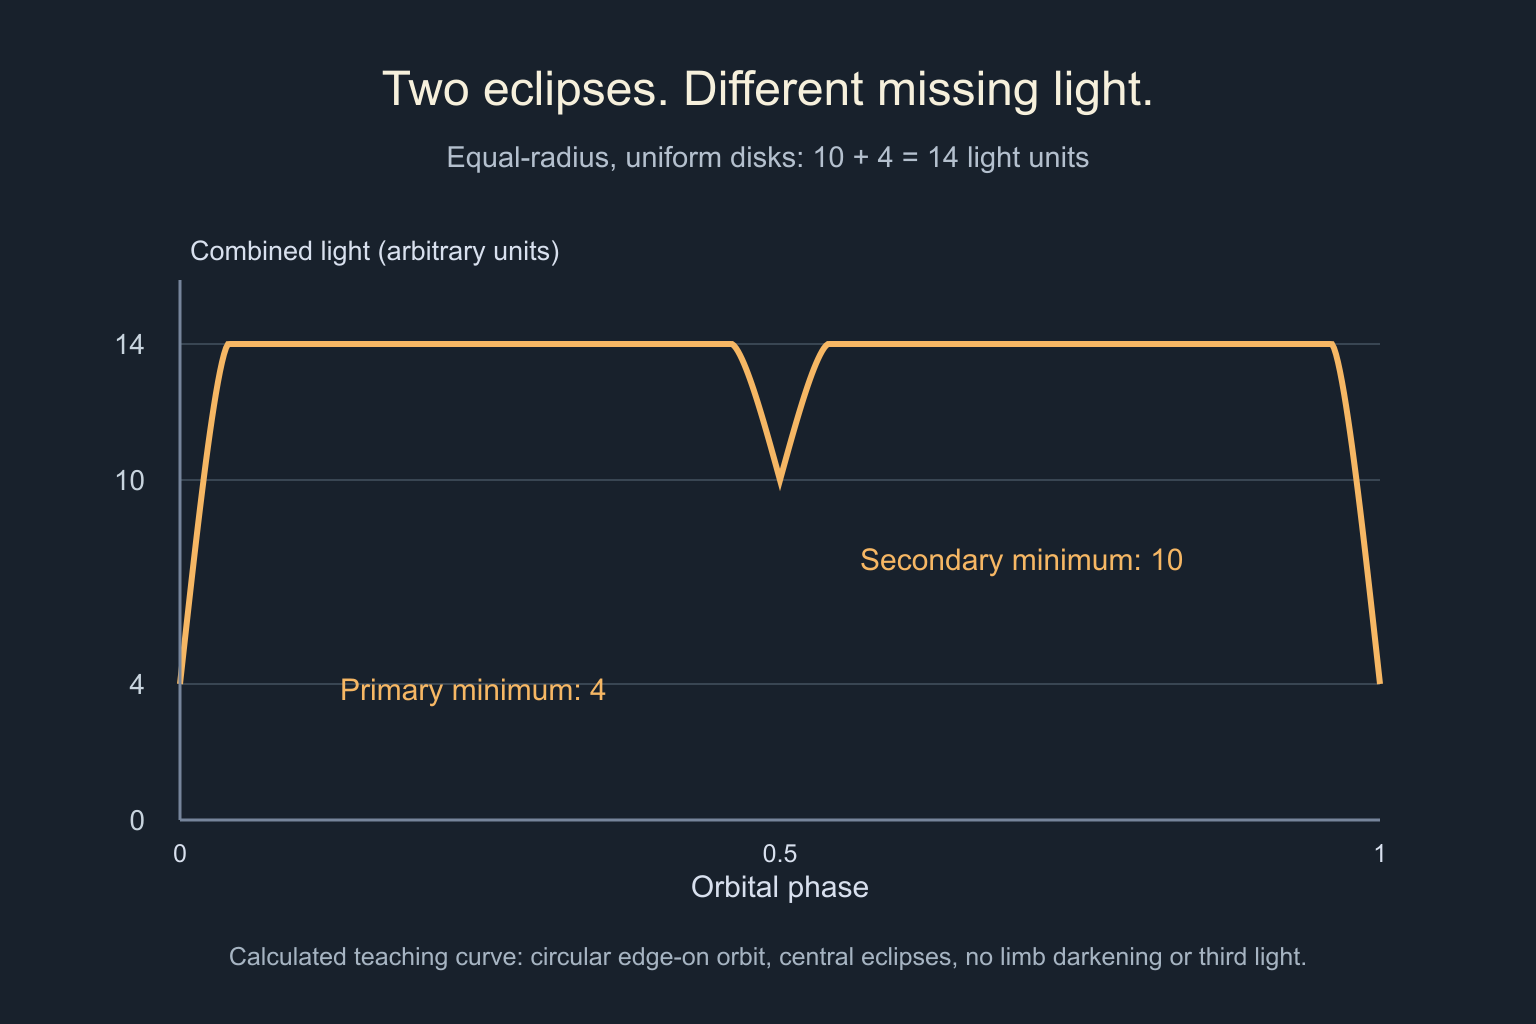
An eclipsing binary can show two dips of different depths because the stars block different amounts of light when they pass in front of each other. Eclipse depth measures the light missing from the combined system, not directly the mass of the hidden star or the fraction of its diameter that is covered.
To interpret a light curve, consider which star is behind, how much of its visible surface is obscured, and how brightly that surface emits in the observing band. Similar-looking dips can otherwise lead to very different physical explanations.
The telescope usually measures both stars together
Many eclipsing binaries are recorded as one unresolved source. Outside eclipse, the detector receives light from both stars. During an eclipse, the foreground star still shines; it blocks some or all of the light that would have arrived from the star behind it.
The Center for Astrophysics' eclipsing-binary explanation uses this geometry to connect changing brightness with orbital motion. The stars do not need to change their intrinsic energy output every time the measured light falls.
The deeper dip is normally called the primary eclipse, and the shallower one the secondary. These labels describe the observed light curve. They do not automatically rank the stars by mass.
A two-star calculation makes the difference clear
Consider a deliberately simple system. Two spherical stars have equal radii and uniform brightness across each visible disk. Their circular orbit is viewed exactly edge-on, allowing a central eclipse to cover the rear star completely at mid-eclipse. Ignore all other light sources and use the same wavelength band throughout.
Let star A contribute 10 units of received light and star B contribute 4. Outside eclipse, the combined signal is 14 units.
When B completely hides A, only B's 4 units remain. The missing fraction is 10/14, or about 71% of the out-of-eclipse light.
Half an orbit later, A hides B. Now 10 units remain, so the missing fraction is 4/14, or about 29%.
Both stars were completely hidden in turn, yet the depths differ greatly. Conversely, a 29% drop in the system's light does not mean that 29% of a star's disk was covered. These are hypothetical flux units, not observations of a named binary.
Surface brightness and radius are separate ingredients
John Southworth's JKTEBOP modeling notes distinguish the radius ratio, surface-brightness ratio, total light ratio, and mass ratio. Treating them as interchangeable loses information.
A larger star can emit more total light while having a cooler, dimmer surface per unit area. A smaller, hotter star can therefore produce the deeper eclipse when it is hidden. The exact result depends on the overlapping area as well as the two brightness distributions.
In ordinary simple configurations, the deeper eclipse hides the hotter star. Southworth notes exceptions in eccentric systems, where the geometry can change how much of each surface is covered. “The deeper dip always hides the larger star” is not a reliable rule.
Mass requires additional evidence. Our guide to measuring stellar masses explains how orbital motion supplies constraints that an eclipse depth alone cannot provide.
Real light curves need more than the toy model
A partial or grazing eclipse hides only part of the rear star. Limb darkening means its visible disk need not be equally bright at the center and edge. Light from another unresolved source can dilute a dip by increasing the baseline without participating in the eclipse.
The observing band also matters because stars of different temperatures contribute different proportions of the light at different wavelengths. Comparing a blue-band depth with a red-band depth is not the same as checking two repeated measurements in one band.
These complications appear explicitly in the JKTEBOP model documentation and Southworth's discussion of light-curve analysis. They are reasons to fit a physical model and state its assumptions. A percentage read from a graph is valuable, but it is not already a complete solution for two stellar radii, temperatures, and masses.
What two dips can help establish
Repeated eclipses constrain the orbital period and viewing geometry. Their depths and shapes help test how the stars share the light. Measurements across multiple bands and spectra can add information needed to separate plausible models.
The Zwicky Transient Facility's report of a seven-minute eclipsing white-dwarf pair gives a real example of eclipses used alongside other observations to characterize a system. Its compact stars are not the hypothetical equal-radius pair calculated above.
When reading an eclipsing-binary graph, first check whether the vertical axis is flux or magnitude, identify the out-of-eclipse baseline, and check the band. Those details tell you what a dip measures before you infer what the stars are like.